AI Math Solver
Resources
Questions
Pricing
Login
Register
Home
>
Questions
>
Calculate Mean Customer Ratings for Plumbing Companies and Make a Recommendation
Mathematics
Grade 8 (Junior High School)
Question Content
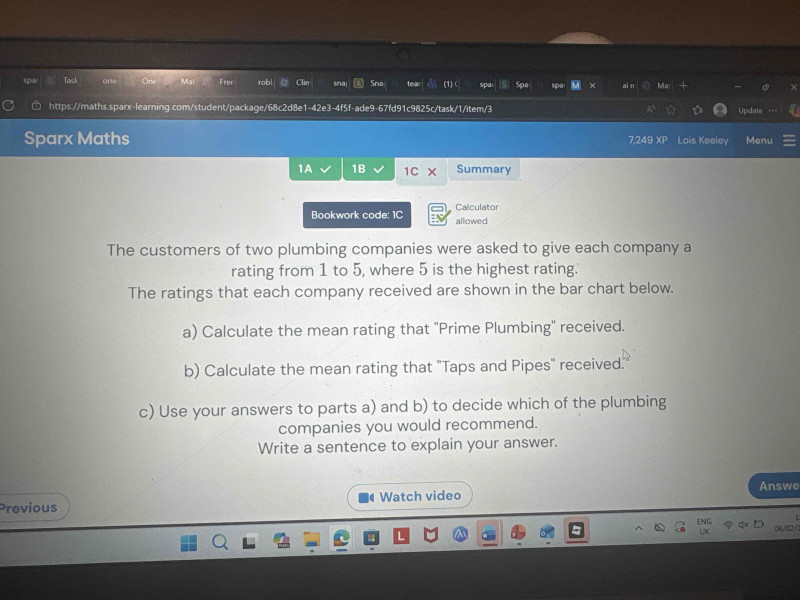
The customers of two plumbing companies were asked to give each company a rating from 1 to 5, where 5 is the highest rating. The ratings that each company received are shown in a bar chart (not displayed, standard setup for this problem: Prime Plumbing has counts: 1→2, 2→3, 3→5, 4→10, 5→10; Taps and Pipes has counts:1→1, 2→4, 3→8, 4→12, 5→5). a) Calculate the mean rating that 'Prime Plumbing' received. b) Calculate the mean rating that 'Taps and Pipes' received. c) Use your answers to parts a) and b) to decide which of the plumbing companies you would recommend. Write a sentence to explain your answer.
Correct Answer
a) 3.8; b) 3.5; c) I would recommend Prime Plumbing, because it has a higher mean customer rating, indicating overall better customer satisfaction.
Detailed Solution Steps
1
Step 1: For part a) Prime Plumbing: First, identify the number of customers who gave each rating: 2 customers gave 1, 3 gave 2, 5 gave 3, 10 gave 4, 10 gave 5.
2
Step 2: Calculate the total rating points: (1×2) + (2×3) + (3×5) + (4×10) + (5×10) = 2 + 6 + 15 + 40 + 50 = 113. Calculate total customers: 2+3+5+10+10=30. Mean = 113÷30≈3.8.
3
Step 3: For part b) Taps and Pipes: Identify customer counts per rating:1 gave 1, 4 gave 2, 8 gave 3,12 gave4,5 gave5.
4
Step4: Calculate total rating points: (1×1)+(2×4)+(3×8)+(4×12)+(5×5)=1+8+24+48+25=106. Total customers:1+4+8+12+5=30. Mean=106÷30≈3.5.
5
Step5: For part c) Compare the two means: 3.8 > 3.5. A higher mean rating shows better overall customer satisfaction, so recommend Prime Plumbing.
Knowledge Points Involved
1
Mean Calculation for Grouped Data
This is the process of finding the average of data that is grouped by categories (here, 1-5 ratings). The formula is: Mean = (Sum of (Category Value × Frequency of Category)) ÷ Total Number of Data Points. It is used when you have repeated values and need to find a representative average, common in survey data analysis.
2
Interpreting Mean as a Measure of Central Tendency
The mean represents the 'balance point' of a data set. In customer rating contexts, a higher mean indicates a higher overall level of satisfaction, as it reflects the average experience of all customers. It is useful for comparing two or more groups to find an overall preference.
3
Data Analysis from Bar Charts
Bar charts display categorical data with rectangular bars, where the height of each bar represents the frequency of the category. To use a bar chart for calculations, you first extract the frequency (number of observations) for each category, which is essential for computing summary statistics like the mean.
Loading solution...