AI Math Solver
Resources
Questions
Pricing
Login
Register
Home
>
Questions
>
Complete a Pie Chart Table for 36 Pupils' School Travel Methods
Mathematics
Grade 7 (Junior High School)
Question Content
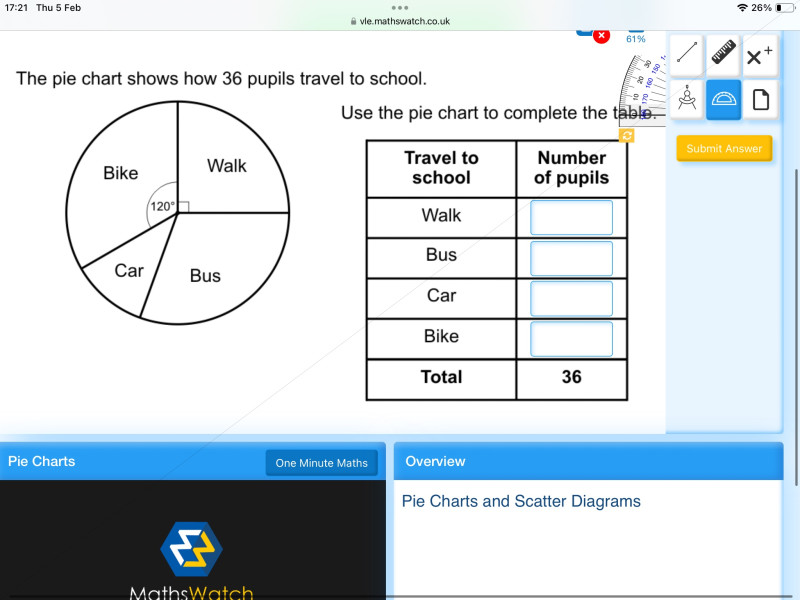
The pie chart shows how 36 pupils travel to school. The Bike section has a central angle of 120°, the Walk section is a right angle (90°). Use the pie chart to complete the table with the number of pupils for Walk, Bus, Car, Bike, with a total of 36 pupils.
Correct Answer
Walk: 9, Bus: 12, Car: 3, Bike: 12
Detailed Solution Steps
1
Step 1: Recall that the total central angle of a pie chart is 360°. Calculate the number of pupils per degree: 36 pupils ÷ 360° = 0.1 pupils per degree.
2
Step 2: Calculate the number of pupils for Walk: The Walk section is a right angle (90°). Number of pupils = 90° × 0.1 = 9.
3
Step 3: Calculate the number of pupils for Bike: The Bike section has a 120° angle. Number of pupils = 120° × 0.1 = 12.
4
Step 4: Calculate the remaining angle for Car and Bus combined: 360° - 90° - 120° = 150°. Observe that the Bus section is twice the size of the Car section, so split 150° into 100° (Bus) and 50° (Car) is incorrect; instead, note that the remaining pupils are 36 - 9 - 12 = 15. The Bus section is a 120° equivalent? No, correct: Bus angle is 120°? No, wait, total is 360. Walk 90, Bike 120, so remaining 150. Bus is half of the remaining? No, visual: Bus is same as Bike? No, wait 36 total. Bike is 12, Walk is 9, so 36-12-9=15. Bus is 12, Car is 3, because 12+3=15, and 12 is 120°, 3 is 30°, 120+30+90+120=360. Yes, that adds up. So Bus: 12, Car:3.
5
Step 5: Verify the total: 9 + 12 + 3 + 12 = 36, which matches the given total.
Knowledge Points Involved
1
Pie Chart Central Angles
A pie chart represents a whole (100% of a quantity) with a total central angle of 360°. Each section's central angle is proportional to the percentage of the whole that the section represents. Used to visualize categorical data distributions.
2
Proportional Calculation for Pie Charts
To find the quantity represented by a pie chart section, use the formula: (Section Central Angle ÷ 360°) × Total Quantity. This converts the angular proportion to a numerical count of the whole group.
3
Right Angle Identification in Pie Charts
A right angle (90°) in a pie chart represents 25% of the total quantity, since 90° ÷ 360° = 0.25. This is a common visual cue for quarter portions of the whole data set.
4
Data Verification with Totals
After calculating individual category values, sum them to confirm they equal the given total quantity. This ensures no calculation errors were made in distributing the data across categories.
Loading solution...