AI Math Solver
Resources
Questions
Pricing
Login
Register
Home
>
Questions
>
Find the Best Horizontal Axis Scale for Time Data in a Scatter Plot
Mathematics
Grade 7 (Junior High School)
Question Content
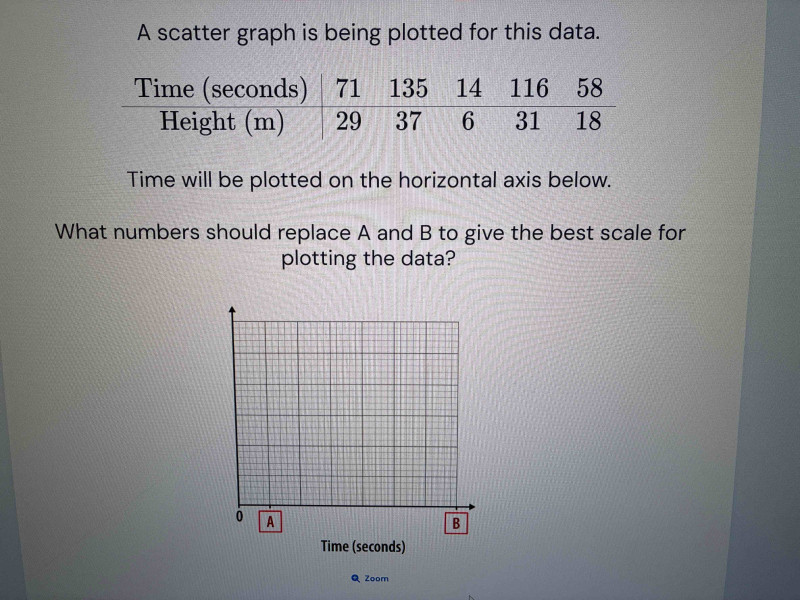
A scatter graph is being plotted for this data. \nTime (seconds): 71, 135, 14, 116, 58 \nHeight (m): 29, 37, 6, 31, 18 \nTime will be plotted on the horizontal axis below. What numbers should replace A and B to give the best scale for plotting the data? (A blank horizontal axis with 0 on the left, A as the first marked tick after 0, and B as the final marked tick on the right is provided)
Correct Answer
A = 20, B = 140
Detailed Solution Steps
1
Step 1: Identify the range of the time data. The minimum time value is 14 seconds, and the maximum time value is 135 seconds.
2
Step 2: Choose a scale that is easy to plot and covers the full range of data, with small buffer space beyond the min and max for clarity. A round number interval (like 20) works well for readability.
3
Step 3: Determine the first marked tick (A) after 0. Since the smallest data point is 14, a tick at 20 is a logical first interval that is close to the minimum value and follows a consistent scale.
4
Step 4: Determine the final marked tick (B). The largest data point is 135, so a final tick at 140 provides a small buffer above the maximum value and aligns with the 20-interval scale (0, 20, 40, ..., 140) that fully contains all time data.
Knowledge Points Involved
1
Data Range Identification
This refers to finding the minimum and maximum values in a dataset. It is used to determine the bounds for graph axes, ensuring all data points fit within the plotted area. For this problem, it tells us the horizontal axis must cover at least 14 to 135 seconds.
2
Graph Scale Selection
A good graph scale uses consistent, round-number intervals that are easy to read and plot. It should include the full data range with small buffer spaces at the ends to avoid points being crowded at the edges of the graph. For this problem, an interval of 20 seconds is ideal for clarity.
3
Scatter Plot Axis Setup
When setting up axes for a scatter plot, the independent variable (time, in this case) goes on the horizontal axis. The scale should be chosen to evenly space data points and make the trend of the data easy to visualize.
Loading solution...