AI Math Solver
Resources
Questions
Pricing
Login
Register
Home
>
Questions
>
Interpret Distance-Time Graph Segment: John's Walk to School
Mathematics
Grade 8 of Junior High School
Question Content
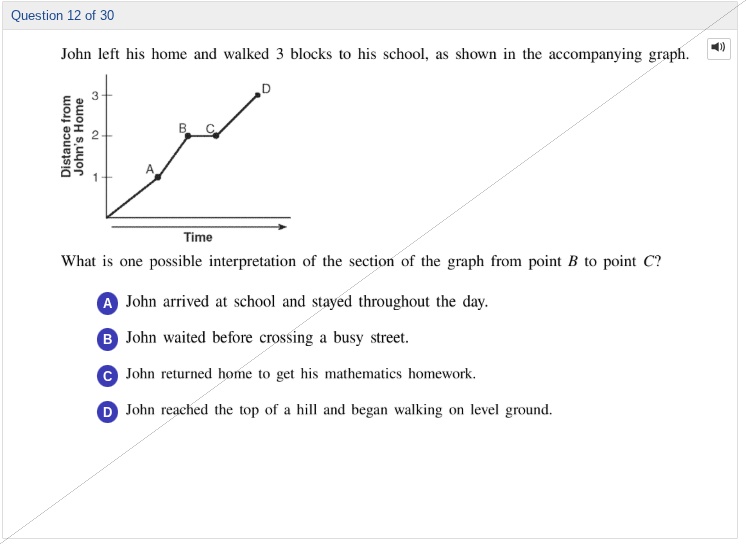
John left his home and walked 3 blocks to his school, as shown in the accompanying graph. What is one possible interpretation of the section of the graph from point B to point C?\nA. John arrived at school and stayed throughout the day.\nB. John waited before crossing a busy street.\nC. John returned home to get his mathematics homework.\nD. John reached the top of a hill and began walking on level ground.
Correct Answer
B
Detailed Solution Steps
1
Step 1: Analyze the meaning of the graph axes. The vertical axis represents distance from John's home, and the horizontal axis represents time.
2
Step 2: Interpret the segment from B to C. During this segment, time increases (moves right along the horizontal axis) but distance from home stays constant (does not move up or down on the vertical axis). This means John was not moving away from or toward home during this time.
3
Step 3: Evaluate each option:\n- Option A: The final point D shows John reaches 3 blocks from home, so B to C cannot be him staying at school all day. Eliminate A.\n- Option B: Waiting before crossing a street means John is not moving, so his distance from home stays the same while time passes. This matches the B to C segment.\n- Option C: Returning home would decrease his distance from home, which would show a downward slope on the graph, not a flat line. Eliminate C.\n- Option D: Walking on level ground would mean he continues moving away from home, so distance would increase with time, not stay constant. Eliminate D.
4
Step 4: Confirm that Option B is the only choice that matches the flat line (constant distance, increasing time) of the B to C segment.
Knowledge Points Involved
1
Distance-Time Graph Interpretation
A distance-time graph plots distance from a starting point on the vertical axis and time on the horizontal axis. A flat horizontal line means the object is stationary (distance does not change as time passes); an upward sloping line means the object is moving away from the starting point; a downward sloping line means the object is moving back toward the starting point.
2
Real-World Application of Graphs
Mathematical graphs can be used to model real-life scenarios. For motion graphs, each segment corresponds to a specific action (moving, stopping, returning), and we can match graph features to real-world behaviors.
3
Logical Elimination for Multiple Choice
When solving multiple-choice problems, eliminate options that contradict the given data (in this case, the graph's features) to narrow down to the correct answer. This involves checking each option against the information provided and ruling out impossible choices.
Loading solution...