AI Math Solver
Resources
Questions
Pricing
Login
Register
Home
>
Questions
>
Which Graph Represents the Homecoming Ticket Fundraising Inequality Situation?
Mathematics
Grade 9 (Junior High School)
Question Content
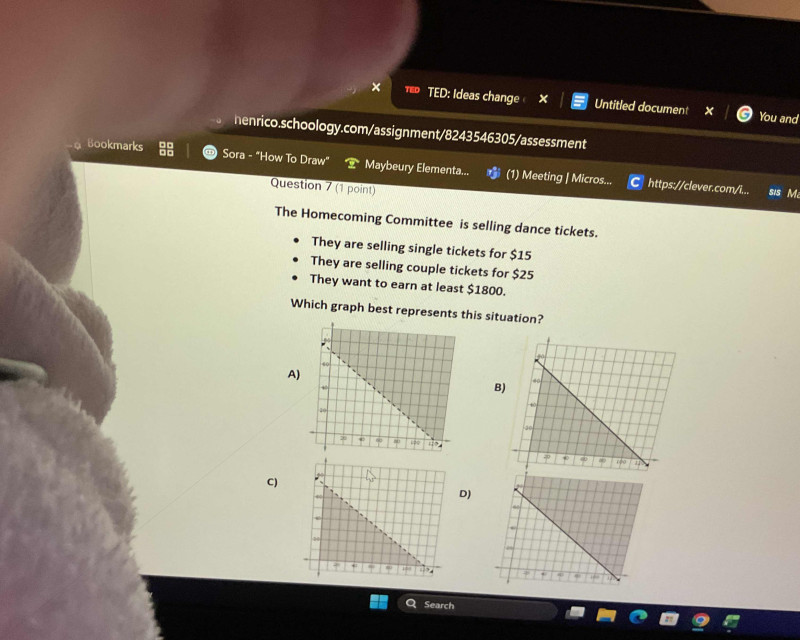
The Homecoming Committee is selling dance tickets. They are selling single tickets for $15. They are selling couple tickets for $25. They want to earn at least $1800. Which graph best represents this situation? (Options are 4 graphs labeled A, B, C, D with shaded regions and lines on a coordinate grid)
Correct Answer
Graph A
Detailed Solution Steps
1
Step 1: Define variables. Let x = number of single tickets sold, y = number of couple tickets sold.
2
Step 2: Write the inequality for the situation. Since single tickets cost $15, couple tickets cost $25, and they need at least $1800, the inequality is 15x + 25y ≥ 1800.
3
Step 3: Simplify the inequality. Divide all terms by 5: 3x + 5y ≥ 360. Then rearrange to slope-intercept form (y = mx + b) to graph: 5y ≥ -3x + 360 → y ≥ (-3/5)x + 72.
4
Step 4: Identify key features of the graph. The boundary line is y = (-3/5)x + 72, which has a y-intercept of 72 and an x-intercept found by setting y=0: 0 = (-3/5)x +72 → (3/5)x=72 → x=120. Since the inequality uses ≥, the boundary line is solid (not dashed), and we shade the region above the line (where y values are greater than the line's values).
5
Step 5: Match to the options. Graph A has a solid line with intercepts (0,72) and (120,0), and the shaded region is above the line, which matches all requirements.
Knowledge Points Involved
1
Linear Inequalities in Two Variables
A linear inequality in two variables (like ax + by ≥ c) represents a region of the coordinate plane. The inequality sign determines whether the boundary line is solid (≥, ≤) or dashed (>, <), and which side of the line is shaded (above for ≥, >; below for ≤, <) to show all valid solutions.
2
Slope-Intercept Form of a Line
The slope-intercept form is y = mx + b, where m is the slope (rate of change) and b is the y-intercept (where the line crosses the y-axis). This form is used to easily graph lines and identify their key features, which helps in graphing linear inequalities.
3
Writing Inequalities from Real-World Scenarios
When translating real-world problems to inequalities, words like 'at least', 'no more than', 'minimum' correspond to specific inequality signs: 'at least' means ≥, 'no more than' means ≤. Variables are defined to represent unknown quantities, and the inequality is built from the problem's cost/value relationships.
4
Finding Intercepts of a Linear Equation
The x-intercept is the point where a line crosses the x-axis (y=0), and the y-intercept is where it crosses the y-axis (x=0). These points are used to quickly graph a linear equation, as only two points are needed to draw a straight line.
Loading solution...